
Using Predictive Analytics in EdTech to Reduce Dropouts

How to Use Predictive Analytics for EdTech to Reduce Dropouts

January 28, 2026
Data Analytics
How to Use Predictive Analytics for EdTech to Reduce Dropouts
Every CXO in education knows the headline: enrollment volatility and student churn quietly eat margin, reputation and impact. But there’s good news institutions that apply predictive analytics to student success are moving from firefighting to prevention: identifying learners at risk earlier, personalising support, and materially improving retention and graduation outcomes.
Several leading institutions have paired data, human workflows and governance to convert analytics into measurable outcomes higher graduation rates, improved enrollment yield, and clearer ROI. Here is how CXOs may use predictive analytics on existing data for practical implementation.
Why Predictive Analytics Matters Now
EdTech products and modern universities sit on vast behaviour dataLMS clicks, assessment patterns, support requests, attendance logs, payment history and more. When combined, these signals form a predictive surface that can forecast who’s likely to disengage or drop out before failure becomes inevitable.
For CXOs, the opportunity is two-fold:
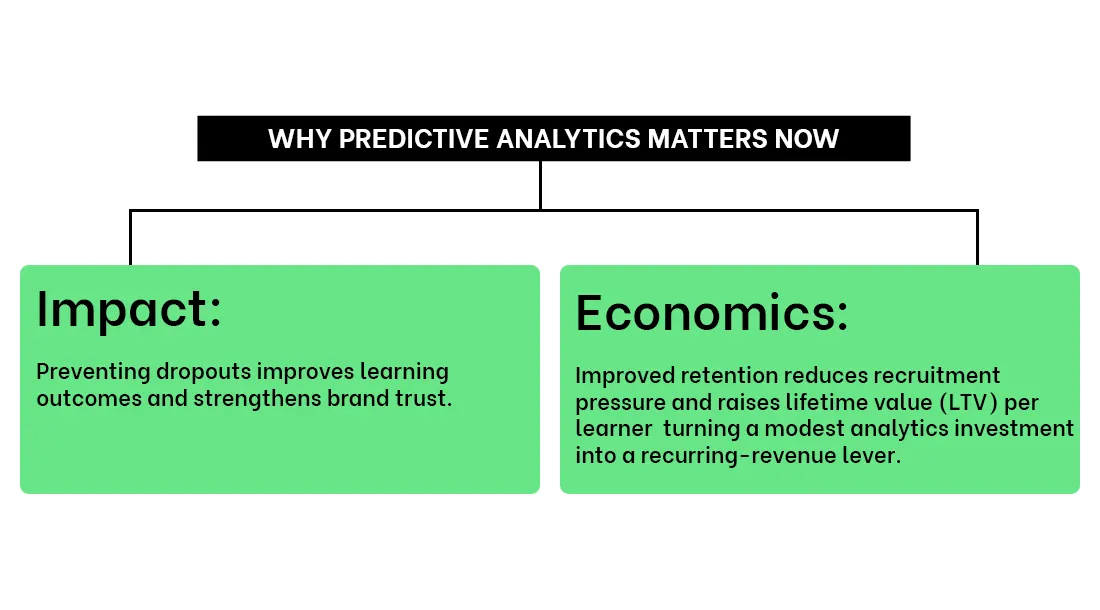
- Impact: Preventing dropouts improves learning outcomes and strengthens brand trust.
- Economics: Improved retention reduces recruitment pressure and raises lifetime value (LTV) per learner turning a modest analytics investment into a recurring-revenue lever.
McKinsey and BCG both highlight that next-generation operational excellence and high-quality digital learning depend on people + process + tech working together analytics is the connective tissue that makes that work measurable and repeatable.
Hard Results: What The Data Shows
Given below are a few examples which showcase measurable impact when analytics are suitably applied on interventions.
Georgia State University (GSU) Predictive analytics + automated advising and micro-grants helped close equity gaps and raise graduation rates materially. GSU’s 6-year graduation rate rose into the mid-50% range (reported as ~54%), a ~20+ percentage point gain over a 15-year modernization that included data-driven advising and chatbots a change that translated to both mission and revenue upside (one report estimated each 1-percentage-point rise in graduation generates roughly $3M in additional institutional revenue, by way of retention and tuition).
Purdue University Course Signals (early warning system) one of the earliest, widely-published learning-analytics programs. Studies reported students exposed to Course Signals had retention rates around 87.4% versus 69.4% for peers who did not experience the system a near 18-point lift in retention for those students. (Academic literature discusses experimental caveats, but the signal is consistent: timely alerts + faculty feedback move the needle.)
University of Arizona The University has published internal results where analytic-driven interventions correlated with a ~7% increase in retention and a ~10% rise in graduation rates in certain programs after targeted outreach and advising adjustments. These numbers show the outsized leverage of early identification plus supportive action.
Across cases, the observed impacts manifest in multiple business KPIs: higher monthly active learners (reach), lower dropout (churn) rates, improved graduation (completion) metrics, and improved revenue predictability all of which are directly relevant to CXO dashboards.
Caveat: Critics have raised concerns about bias and privacy in predictive models; institutions must pair analytics with strong governance to avoid harm.

What Works The Operational Model That Turns Signals Into Outcomes
From the case studies and industry best practice (McKinsey/BCG), high-performance learning operations that reduce dropouts share five components:
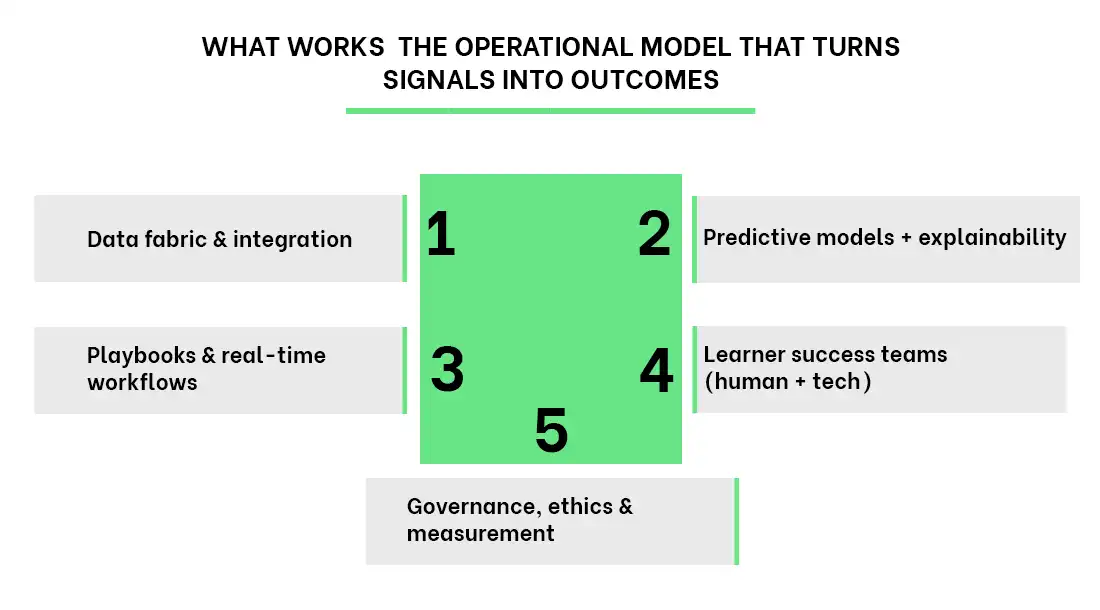
- Data fabric & integration
Combine LMS, CRM, SIS, assessment and financial data into a single analytics layer. Avoid siloed dashboards; aim for a canonical student 360. - Predictive models + explainability
Build models that predict dropout risk using behavioural, academic and financial signals but focus on interpretable features (e.g., sudden decline in weekly activity, missed assessments, unpaid fees) so advisors can act. - Playbooks & real-time workflows
For each risk profile define the intervention: nudges, advisor calls, tutoring, emergency micro-grants, or academic plan adjustments. Automate routing the faster the action, the better the outcome. - Learner success teams (human + tech)
Invest in learner success coaches and triage teams. Analytics should augment, not replace, human judgment chatbots or automation can handle FAQs and routing; humans handle coaching and nuance. - Governance, ethics & measurement
Establish oversight for model fairness, data privacy, and intervention efficacy. Measure the end-to-end impact (not just model accuracy): changes in enrollment yield, drop rates, completion, LTV and brand signals.
BCG’s and McKinsey’s guidance is aligned: technical capability alone won’t deliver leaders must orchestrate people, process and tech, and build continuous feedback loops.
Related Reads :
Building D2C Profitability with Cost Analytics
360° Customer Intelligence for Modern D2C Brands
Suggested 90-Day To 18-Month Plan
0–3 months Pilot & governance
- Select a high-value cohort (e.g., first-year students, income-at-risk cohort).
- Assemble a cross-functional team (product, data, student success, legal).
- Build a minimal data pipeline and a simple risk model (rule-based + logistic).
- Define 2–3 interventions and success metrics (drop rate, engagement lift).
3–9 months Scale & operationalize
- Expand data sources, replace rules with ML models, instrument interventions.
- Hire/align learner success staff and integrate ticketing/CRM.
- Create real-time dashboards for executives and front-line staff.
9–18 months Optimize & embed
- Move to continuous experimentation (A/B test interventions).
- Measure ROI: reduced churn → higher LTV; calculate incremental revenue from retention gains. (Georgia State’s experience shows the financial upside of even a few percentage points in graduation/retention.) (Axios)
- Publish governance and ethics reports; involve student groups to maintain trust.
Important KPIs to Track (Not Exhaustive)
- Churn / dropout rate (monthly / cohort)
- Retention lift % (after intervention)
- Graduation / completion rate (1-yr, 2-yr, 4-yr depending on program)
- Learner engagement (MAU, session length, assessment completion)
- Cost per retained learner (intervention cost vs. LTV uplift)
- Brand visibility & NPS (pre/post program)
Risks & How To Mitigate Them
- False positives / intervention fatigue: Start with low-cost nudges and escalate; measure harm.
- Bias & fairness: Regular bias audits and disaggregated impact reporting.
- Privacy & consent: Be transparent about data use; follow regulations.
- Operational capacity: Don’t automate away human roles augment them and ensure case management capacity.

Recommendation Why CXOs Should Act Now
Predictive analytics is no longer an experimental luxury it’s an operational imperative. Institutions that adopt data-driven learner success frameworks copy the SaaS playbook: measure the funnel, diagnose leaks, and invest where incremental retention scales revenue and mission impact.
The early movers (Georgia State, Purdue, University of Arizona and others) show that modest investment in data + human workflows delivers outsized returns: higher graduation rates, reduced dropouts, improved revenue predictability and improved equity in outcomes. Pair that with disciplined governance and CXOs can shift their organizations from reactive triage to proactive student success at scale. (AGB)
Read Our Other Insights : 360° Customer Intelligence for Modern D2C Brands
Selected References List :
- Georgia State University Student success & analytics case materials.
- “How a chatbot boosted graduation rates at Georgia State” Axios (2019).
- University of Arizona case examples on analytics-driven retention.
- McKinsey Next-generation operational excellence & digital operating models.
- BCG Making Digital Learning Work; digital learning ROI & analytics guidance.
- Purdue Course Signals research (EDUCAUSE / ACM publications).
Authors

AVP, Digital Growth


.webp)
.webp)